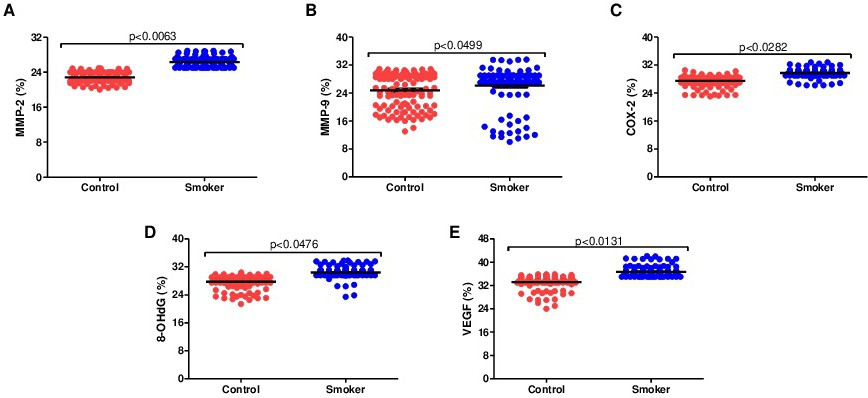
Fig. 4. Representative graphics for the quantitative analysis between the control and smoker groups. Scatter dot plot (each dot represents one field) showing the intensity of (A) MMP-2; (B) MMP-9; (C) COX-2; (D) 8-OHdG; (E) VEGF. Data are mean ± SEM values.